...
Select Site Settings in the admin area menu (1st menu line, 4th left item). Select the upper item Site Heading Settings on the page.
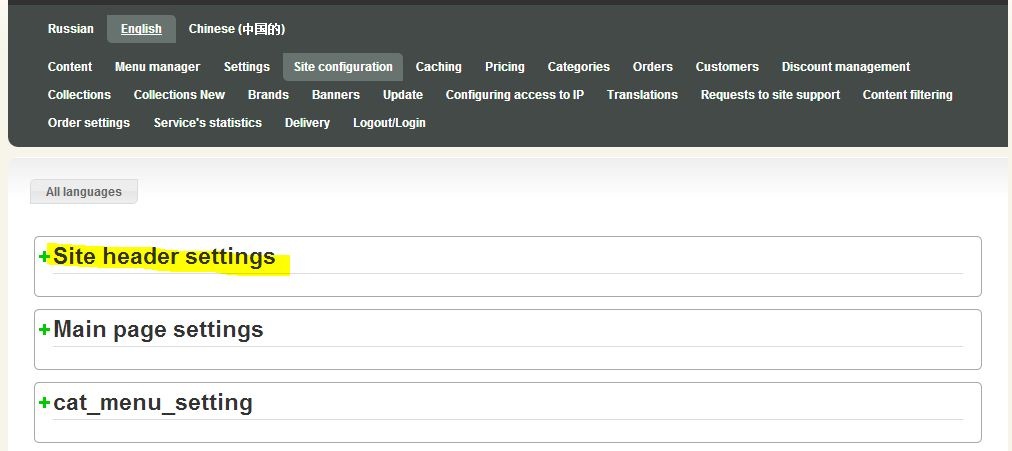
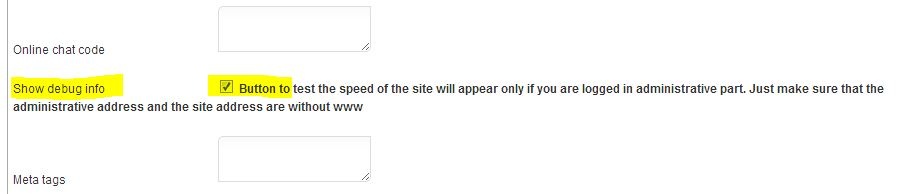
In Site Heading Settings find Display Debugging Information, then click and tick it.
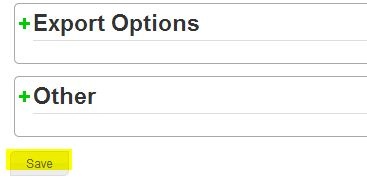
To save the changes press Save button at the bottom of Site Settings page.
When site settings are saved (the debugging information is displayed), clearthe site cache.
Clear Site Cache
In admin area menu select Settings (1st menu line, 3rd left item). When page is open, move to Caching located at the end of the page.
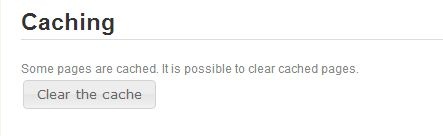
Press ClearCache button. After page reloading you can go to the site and analyze the site speed.
...
A panel with Site Speed Analyzing button was added to the site.
Attention! The button is visible only if you are authorized in the site admin area. Thus, visitors won’t be able to see this panel.
Then go to the page intended for loading speed test (e.g. catalogue page, product card, search results, etc. You shouldn’t test the main page because it is cached automatically). Press Site Speed Analyzing button. If analysis is completed successfully you will be redirected to the diagram page:.
If you open the analyzing page for the first time, the total loading time may reach up to 35 seconds. Some site pages are cached: catalogue pages, product cards, and search results. For their reliable checkout rerun the test. The normal loading time for the recurrent test is:
- For services: up to 6 sec.
- For connection: up to 0.5 sec.
...
If loading time for “services” exceeds 6 seconds, request our support to clarify the reason for low speed. If loading time for “connection” exceeds 0.5 second, your site hosting causes the problem. In this case we recommend you to consider changingyour resource host.
...